Impacts of Compiler Optimization on Cache Latency Profiling
This post is a draft, so it will likely change in the future. Also, I make no guarantees that the post is currently coherent, legible, or enjoyable to read. Read at your own risk :)
As a TA for the computer hardware security course taught at Utah State University I helped create and run a lab where the students used a cache side channel to transmit information between processes using only memory access time latencies to communicate bytes. Likely I’ll one day write a blog post about the whole lab, as it was one of my favorite things I did in university, but alas today is just about a part of it, timing memory accesses.
We ran the lab on machine that had Intel chips, which have hierarchical set-associative memory caches (L1, L2, and L3) inbetween the logical cores and DRAM in order to improve memory access times for data that was accessed regularly. There are many posts about what CPU caches are, so I won’t really offer an explanation beyond this here.
As a general rule of thumb, access to each successive level of cache takes longer than accessing the previous level of cache. The L2 cache is also shared between two cores. Given this information we can take advantage of it to create a covert side channel, where we can pass information between processes using the shared L2 cache. The lab we ran used a basic “prime and probe” attack, where one process would “prime” the L2 cache, effectively filling it for a time, then it would sleep. During that time, the victim process would access some data inside the L2 cache, evicting the data stored by the attacker process. The attacker process would then probe the cache, and based on which data was evicted by the victim the attacker could receive a message.
That was far to short an explanation likely, but hopefully enough for this post to make some sense. A key part in a cache side channel is timing. If you can’t accurately measure how long it takes to load a particular address from memory, you’ll never be able to probe effectively enough to receive a message across the side channel.
What is “Now”?
In modern processors, unfortunately the concept of “now” is a bit amorphous. Modern processors are out-of-order pipelined beasts that speculatively execute your code whenever they feel like it. At any time, you could have 10’s (or more) instructions being executed at once in your processor. Because of this, it’s really hard to tell exactly what instant an instruction is being executed. As you’ll see, we’ll pick and prod at the processor in order to get it to do what we want, but we’ll still see noise and spurious data in our timing analysis.
With poor code, compiler optimizations can get in the way of this timing as well. If the compiler decides to reorder some statements (which it is allowed to do in many circumstances), unroll our loops, or optimize away spurious memory accesses we’ll get no useful timing information at all. Here’s how we managed to get reasonable timing results with both out of order processors and compiler optimizations turned on.
The Psuedocode
Basically, to measure the access time of a specific cache we want to execute some code that looks like this:
1
2
3
4
5
6
7
8
9
10
11
12
13
14
Target Cache = L2

1. Access a single piece of memory, known as the
    target line, pulling it into the L1 cache

2. Access a chunk of memory the size of the cache
    immediately lower than our target cache,
    in this case L1

3. Time the access of the target line. Due to step
    2 the target line should not reside in our
    target cache, so the time it takes to access
    should be the time it takes to access our
    target cache.
In practice, we can basically transform this algorithm into C-code, and then start generating results. A key part of this algorithm (step 3) is timing the access to the target line though, and how do we even do that?
Enter rdtsc
rdtsc is the x86 instruction to read the timestamp counter, which nominally is a counter
that tracks which clock cycle the processor is on. As discussed before “now” is a bit of a
unreachable state with out-of-order speculative CPUs, but reading the timestamp will give us
accurate enough measurements to perform a side channel attack. Using rdtsc (and it’s sibling,
rdtscp) is apparently not as easy as just writing out the assembly instruction, and to
get the best use out of it I had to read a classic book, the Intel Software Developer Manual.
Several volumes thick, this bad boy is a giant pdf that talks about what Intel processors do
and don’t do. In the comments of my code I highlight the specific sections I used to generate
my functions.
1
2
3
4
5
6
7
8
9
10
11
12
13
14
15
16
17
18
19
20
21
22
23
24
25
26
27
28
29
// Reads the time stamp counter as a 64-bit integer value.
// (Code is derived from https://gcc.gnu.org/onlinedocs/gcc/Extended-Asm.html)
//
// This function uses the `rdtscp` instruction to retrieve the
// timestamp. According to the Intel Software Developer Manual
// Vol. 2B, pg. 4-560 `rdtscp` is "not a serializing instruction"
// but it does wait for all previous _loads_ to become visible
// and all previous instructions to execute. It also states that
// for this instruction to complete prior to any following
// instructions running that an `lfence` instruction can be inserted
// immediately following the instruction.
//
// The `rdtsc` instruction returns the lower 32-bits of the timestamp
// into the EAX register, and the upper 32-bits of the timestamp into
// the EDX register. The IA32_TSC_AUX is also stored in the RCX
// register. We don't use this value but we indicate in the inline
// assembly that it's used so that the compiler knows that the value in
// RCX will be overwritten.
static inline __attribute__((always_inline)) uint64_t read_timestamp() {
    uint64_t time;
    asm volatile(
        "rdtscp\n\t"            // Returns the time in EDX:EAX.
        "shl $32, %%rdx\n\t"    // Shift the upper bits left.
        "or %%rdx, %0"          // 'Or' in the lower bits.
        : "=a" (time)           // Put result from RAX into `time` variable
        :
        : "rdx", "rcx");        // Indicate that RDX and RCX will be written to
    return time;
}
If you’ve never written inline assembly before in C, this may look like a mess. That’s because it kind of is. Also, technically, this inline assembly is only valid using GCC’s extended assembly syntax, so I don’t really know if you can even compile this code with Clang or MSVC. Luckily, portability is not a goal for this code.
So, despite it being a mess, we now have a function that we can get the timestamp value of the processor at any time! So, timing an access should be as simple as this:
1
2
3
uint64_t start = read_timestamp();
x = *ptr; // access to time
uint64_t elapsed = read_timestamp() - start;
Right? Please?
Unfortunately, our new bible the Intel Software Developer’s Manual says “maybe not”.
Insert SDM quotes here.
Go over fence instructions.
1
2
3
4
5
6
7
8
9
10
11
12
13
14
15
// Load fence (Intel Software Developer Manual Vol. 1 - 11.4.4.3)
// This function guarantees ordering between two loads and prevents
// speculative loads until all load prior to this instruction have
// been carried out.
static inline __attribute__((always_inline)) void lfence() {
    asm volatile("lfence");
}

// Memory fence (Intel Software Developer Manual Vol. 1 - 11.4.4.3)
// This functions ensures that no loads or stores after this instruction
// will be globally visible until after all loads or stored previous to
// this instruction are globally visible.
static inline __attribute__((always_inline)) void mfence() {
    asm volatile("mfence");
}
Finally, we can complete what we came here to do an write a function that reliabily times accesses to a specific memory address.
1
2
3
4
5
6
7
8
9
10
11
12
// Uses `read_timestamp()` and fencing instruction to time a read access
// to *addr.
static inline __attribute__((always_inline)) uint64_t time_one_line_read_access(const byte *addr) {
    volatile byte b;

    mfence(); // ensure all previous memory access is complete
    const uint64_t time_init = read_timestamp();
    lfence(); // inserted due to the advice in Intel SDM Vol. 2B 4-560
    b = *addr; // read address
    const uint64_t elapsed_time = read_timestamp() - time_init;
    return elapsed_time;
}
Timing Results and Optimizations
As usual, I’m realizing that writing is hard, and I’m doing a lot more it than I originally bargained for. We haven’t even covered the title of this post yet! Here’s the thing, the code we wrote before may be slightly transformed by optimizations.
1
Insert assembly generated by the timing functions
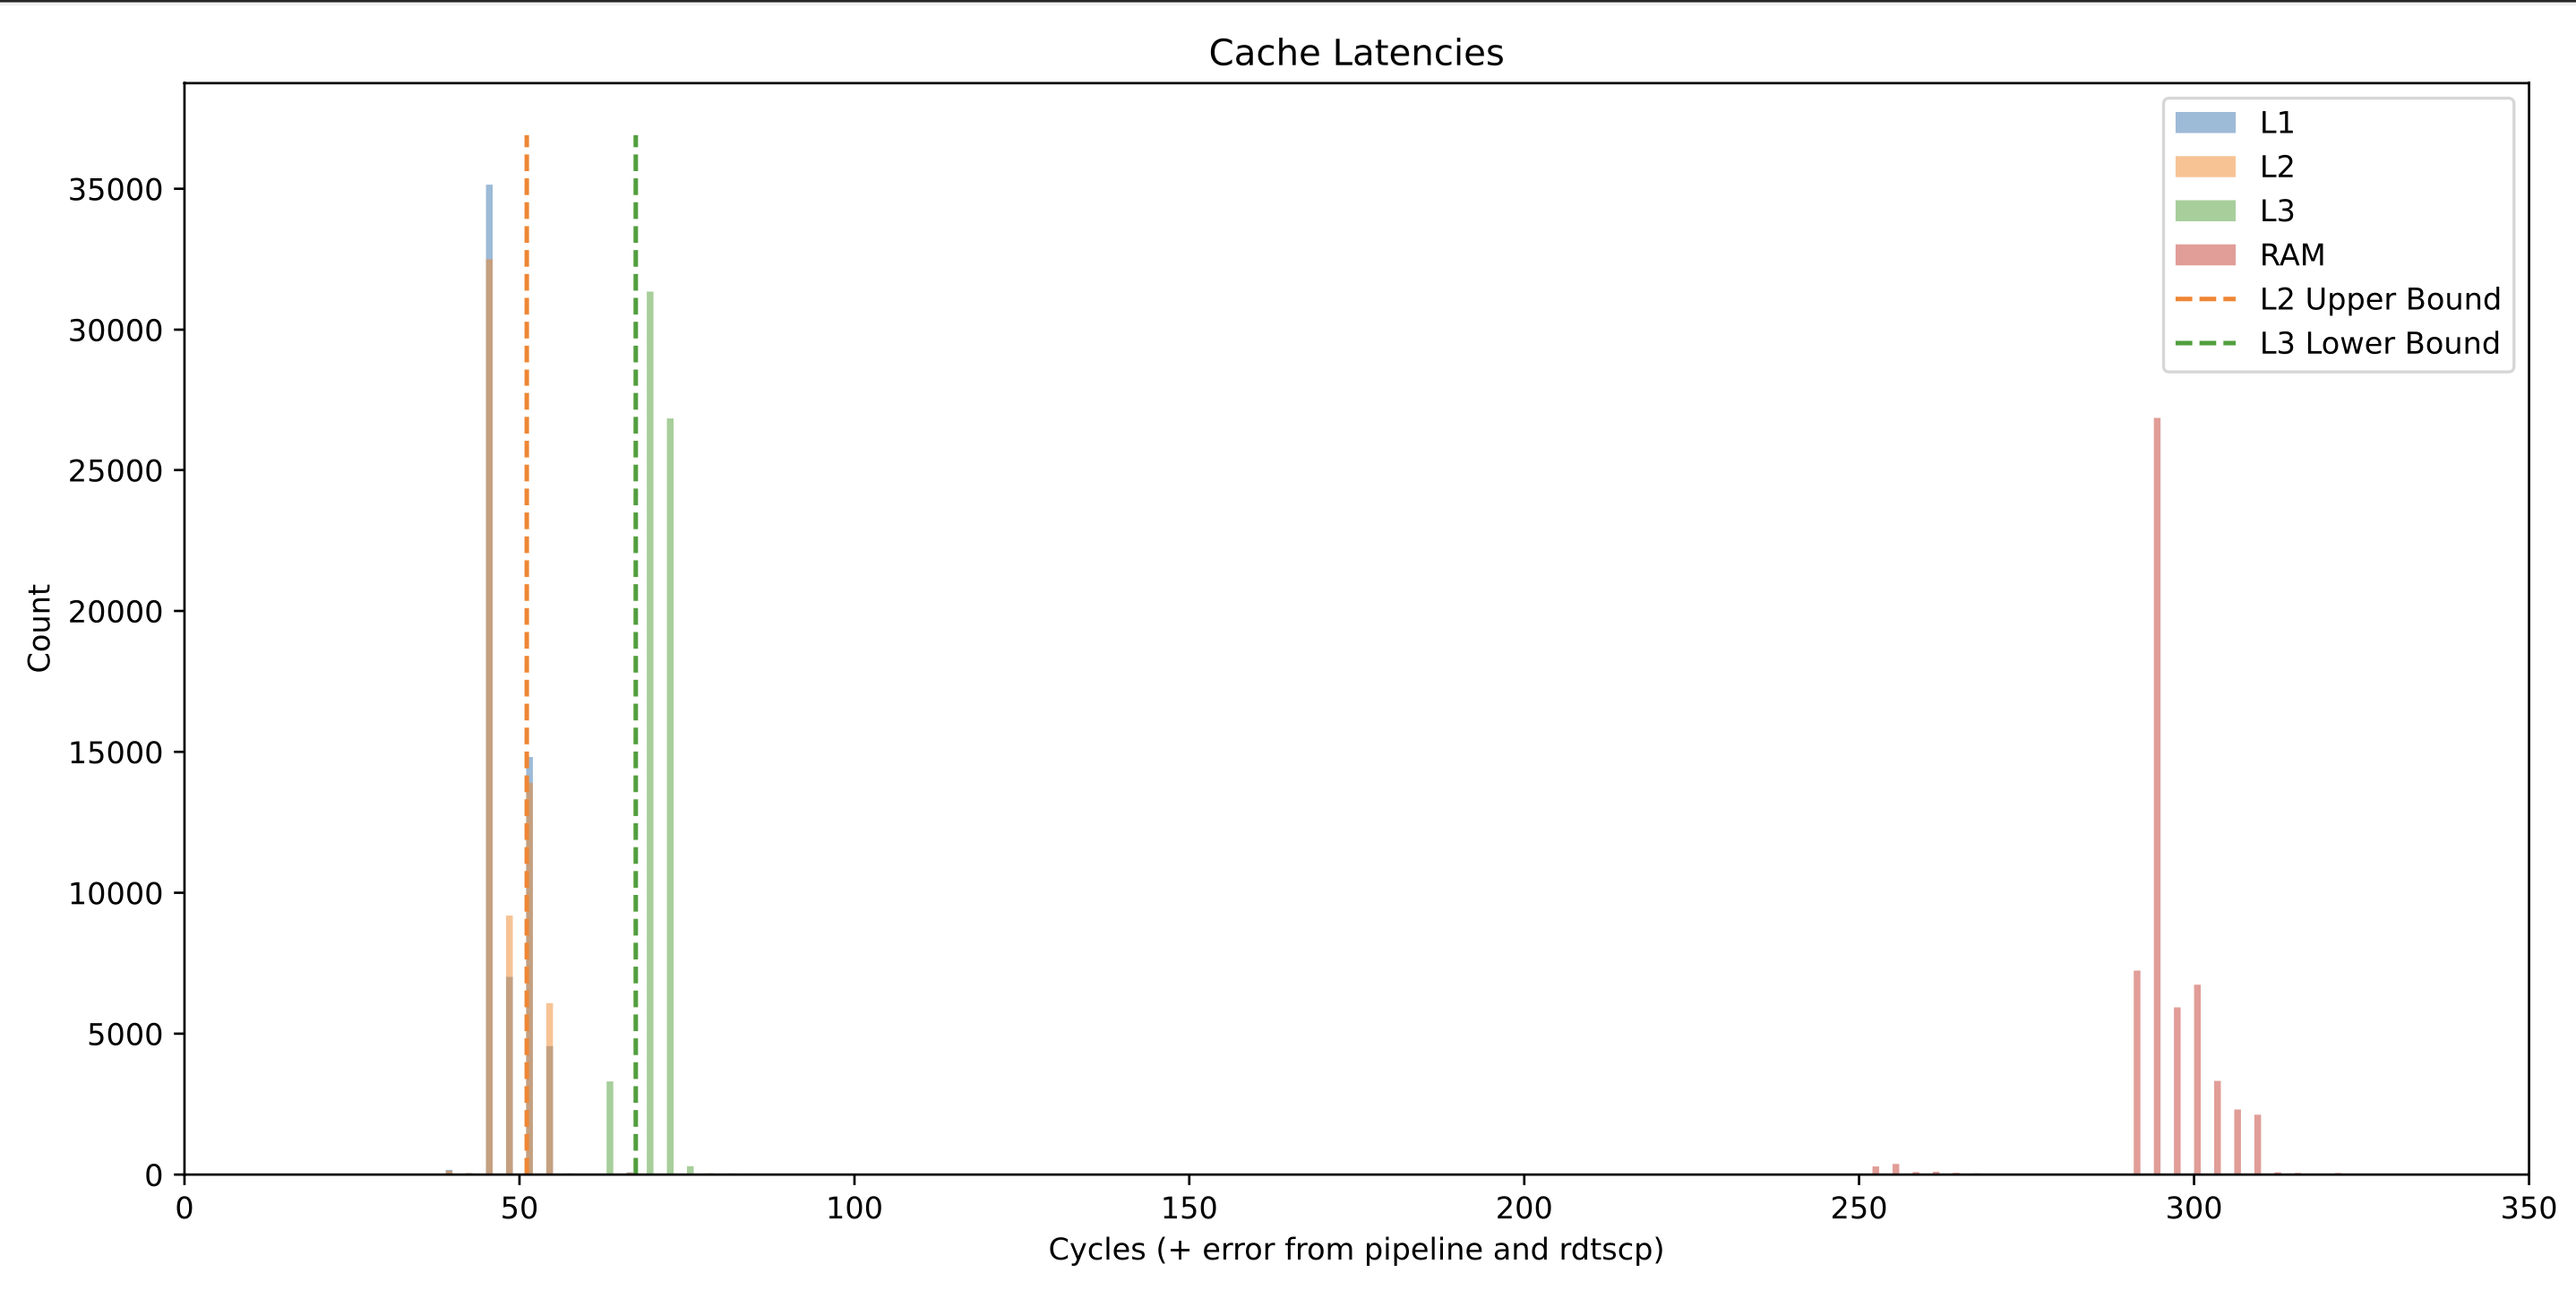
To see the impact that optimization had on timing, I ran the timing analysis on optimization levels O0-O3, and plotted the results. All of the results were generated on an Intel I7-4790 and were run pinned to CPU core 4.
The results show a bar graph of the the timings generated by each run, and the L2 upper bound and L3 lower bound are calculated by taking the mean of each group of measurements and adding one standard deviation to it.
In general, adding optimizations seems to shift the access time of all measurements down by 10 clock cycles or so. The relative separation between the L2 and L3 bounds however remains fairly constant. This means that as long as we profile well and are careful, we should be able to enable optimizations in our cache side channel attack code without a decrease in transmission performance.
-O0
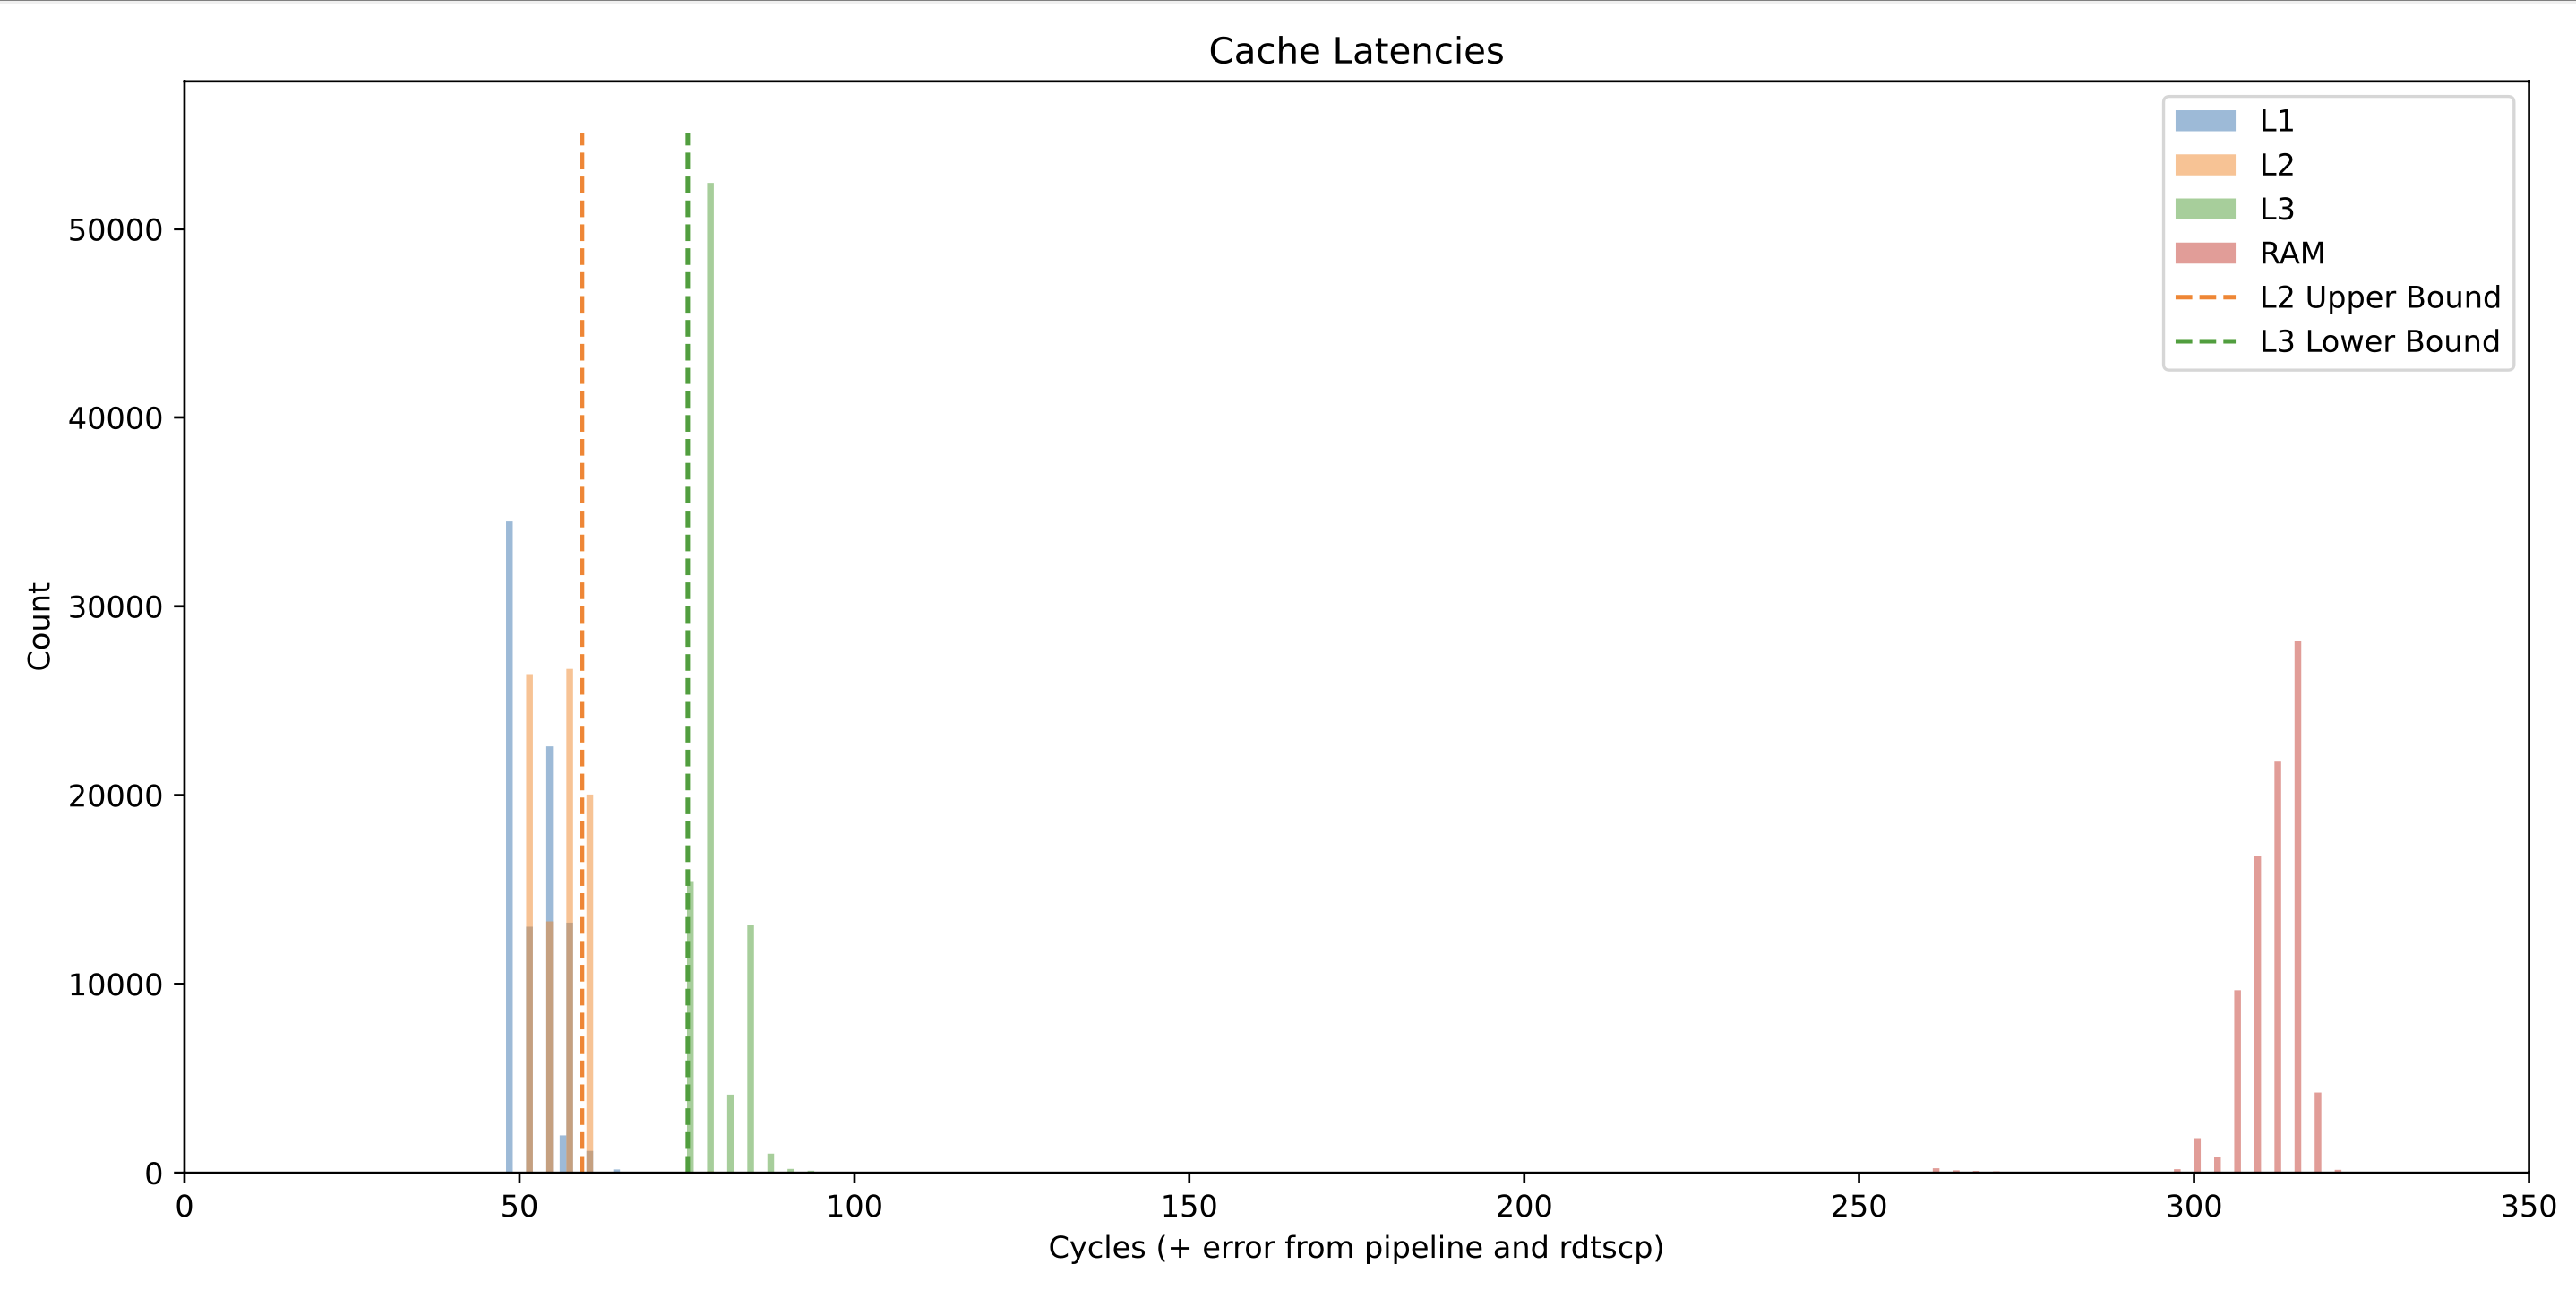
-O1
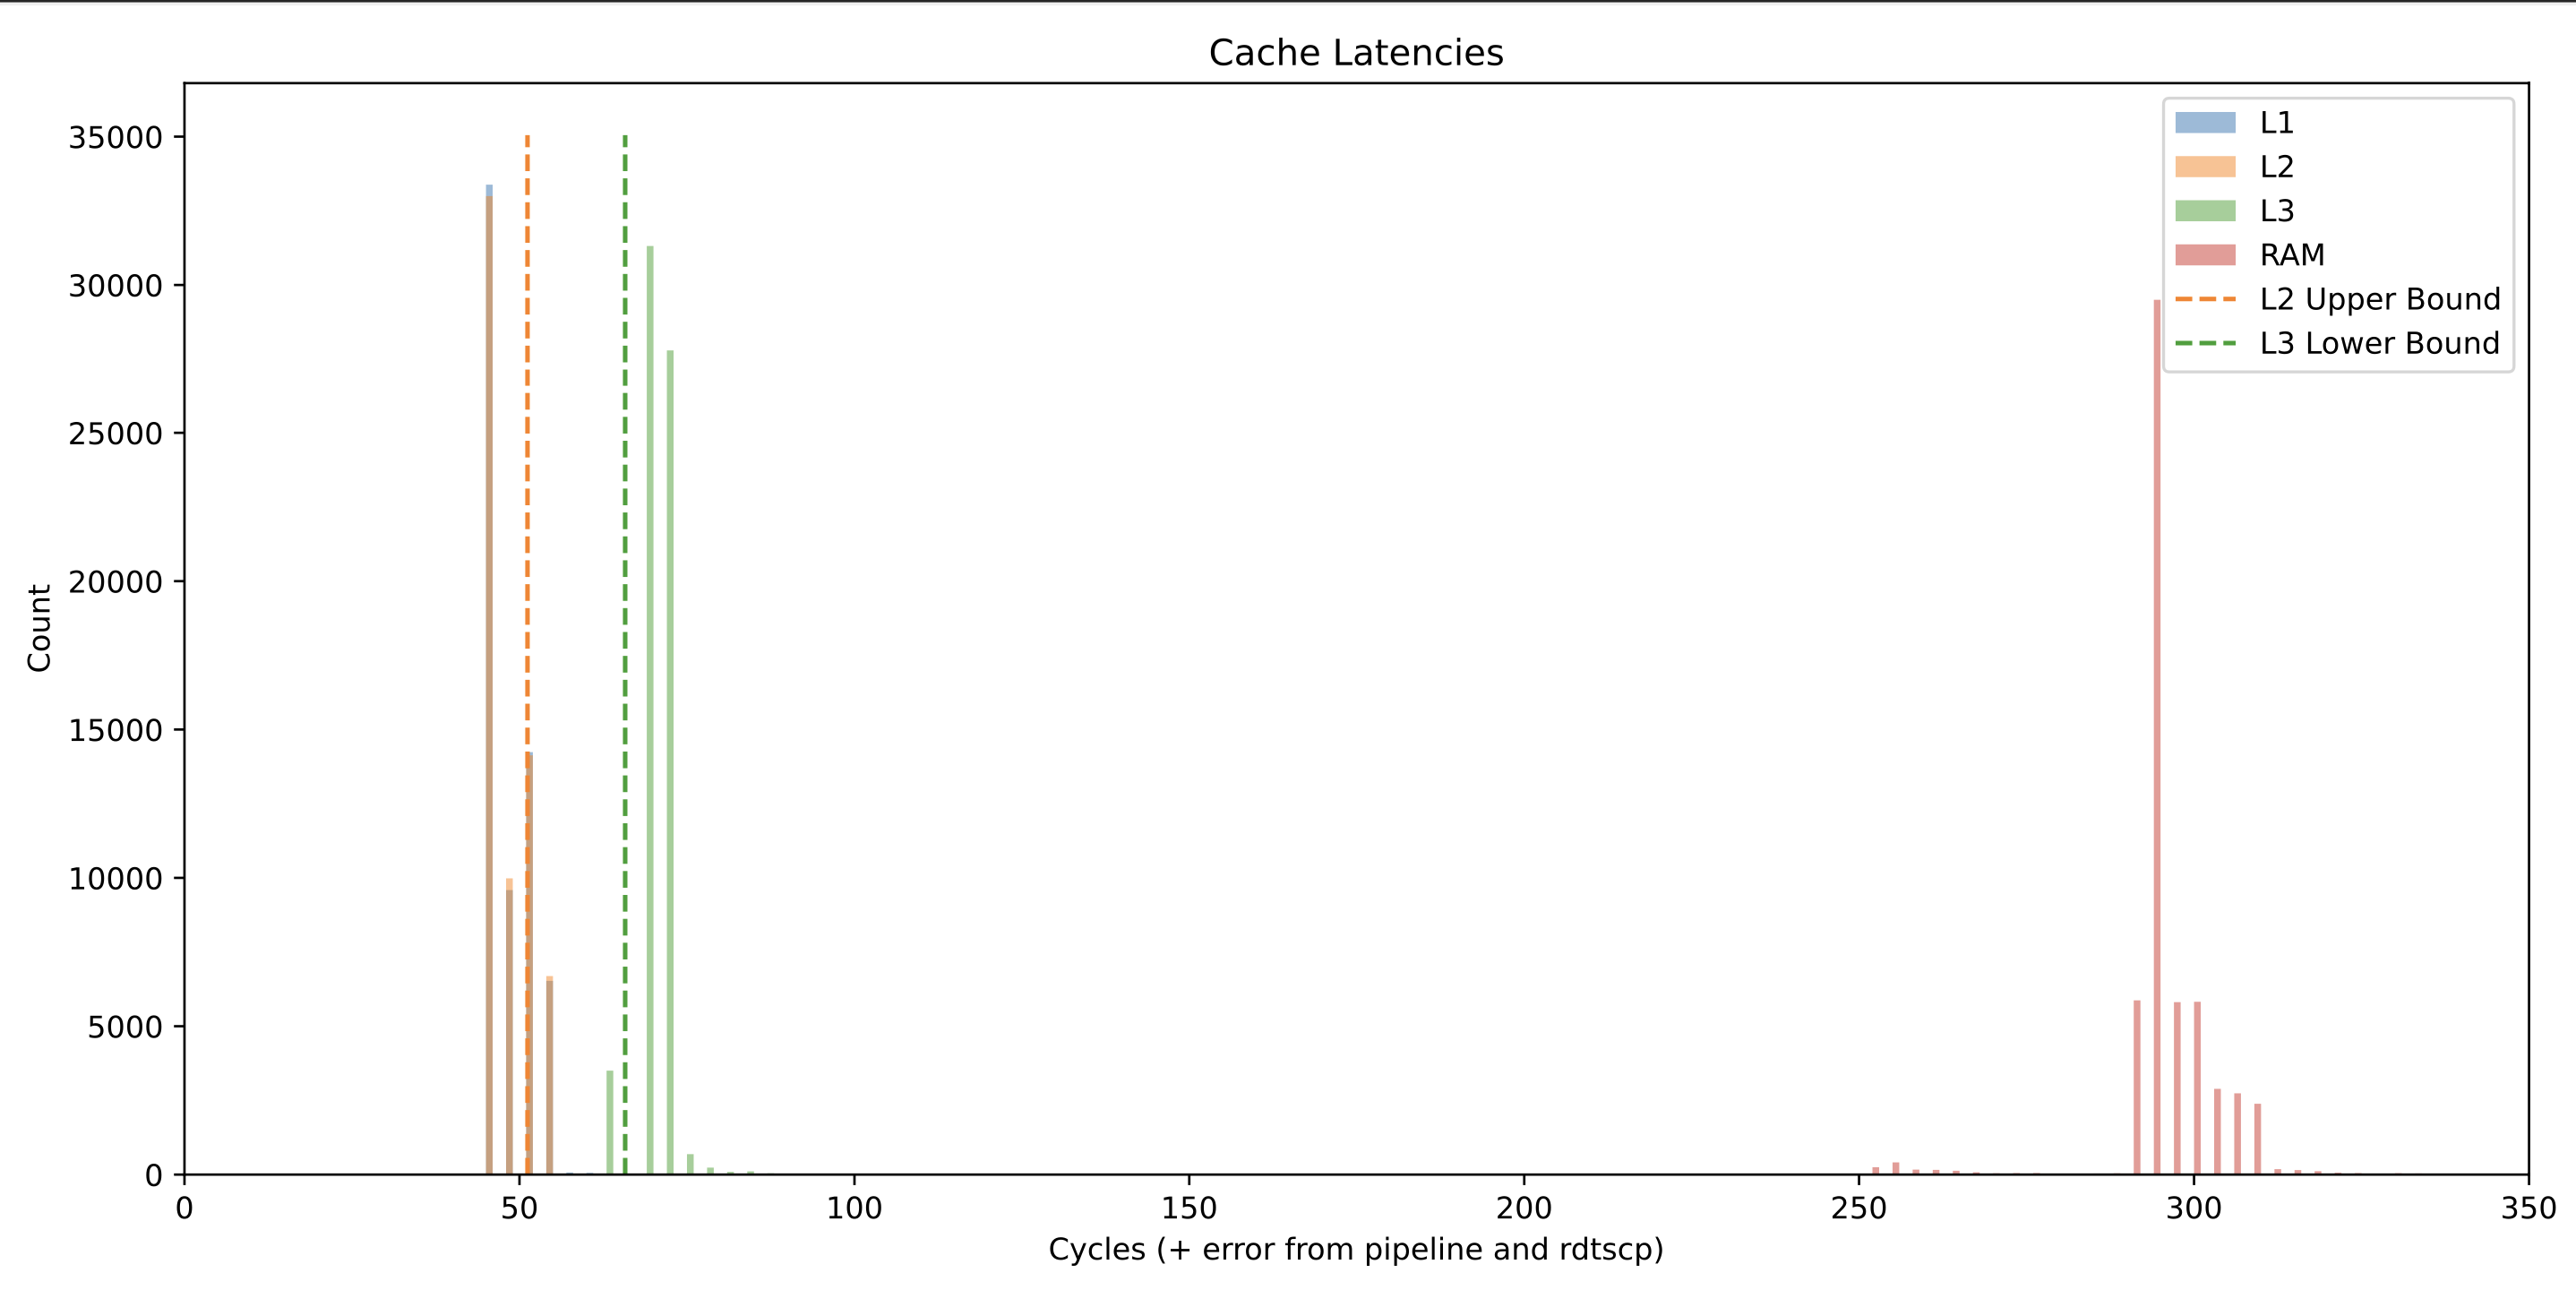
-O2
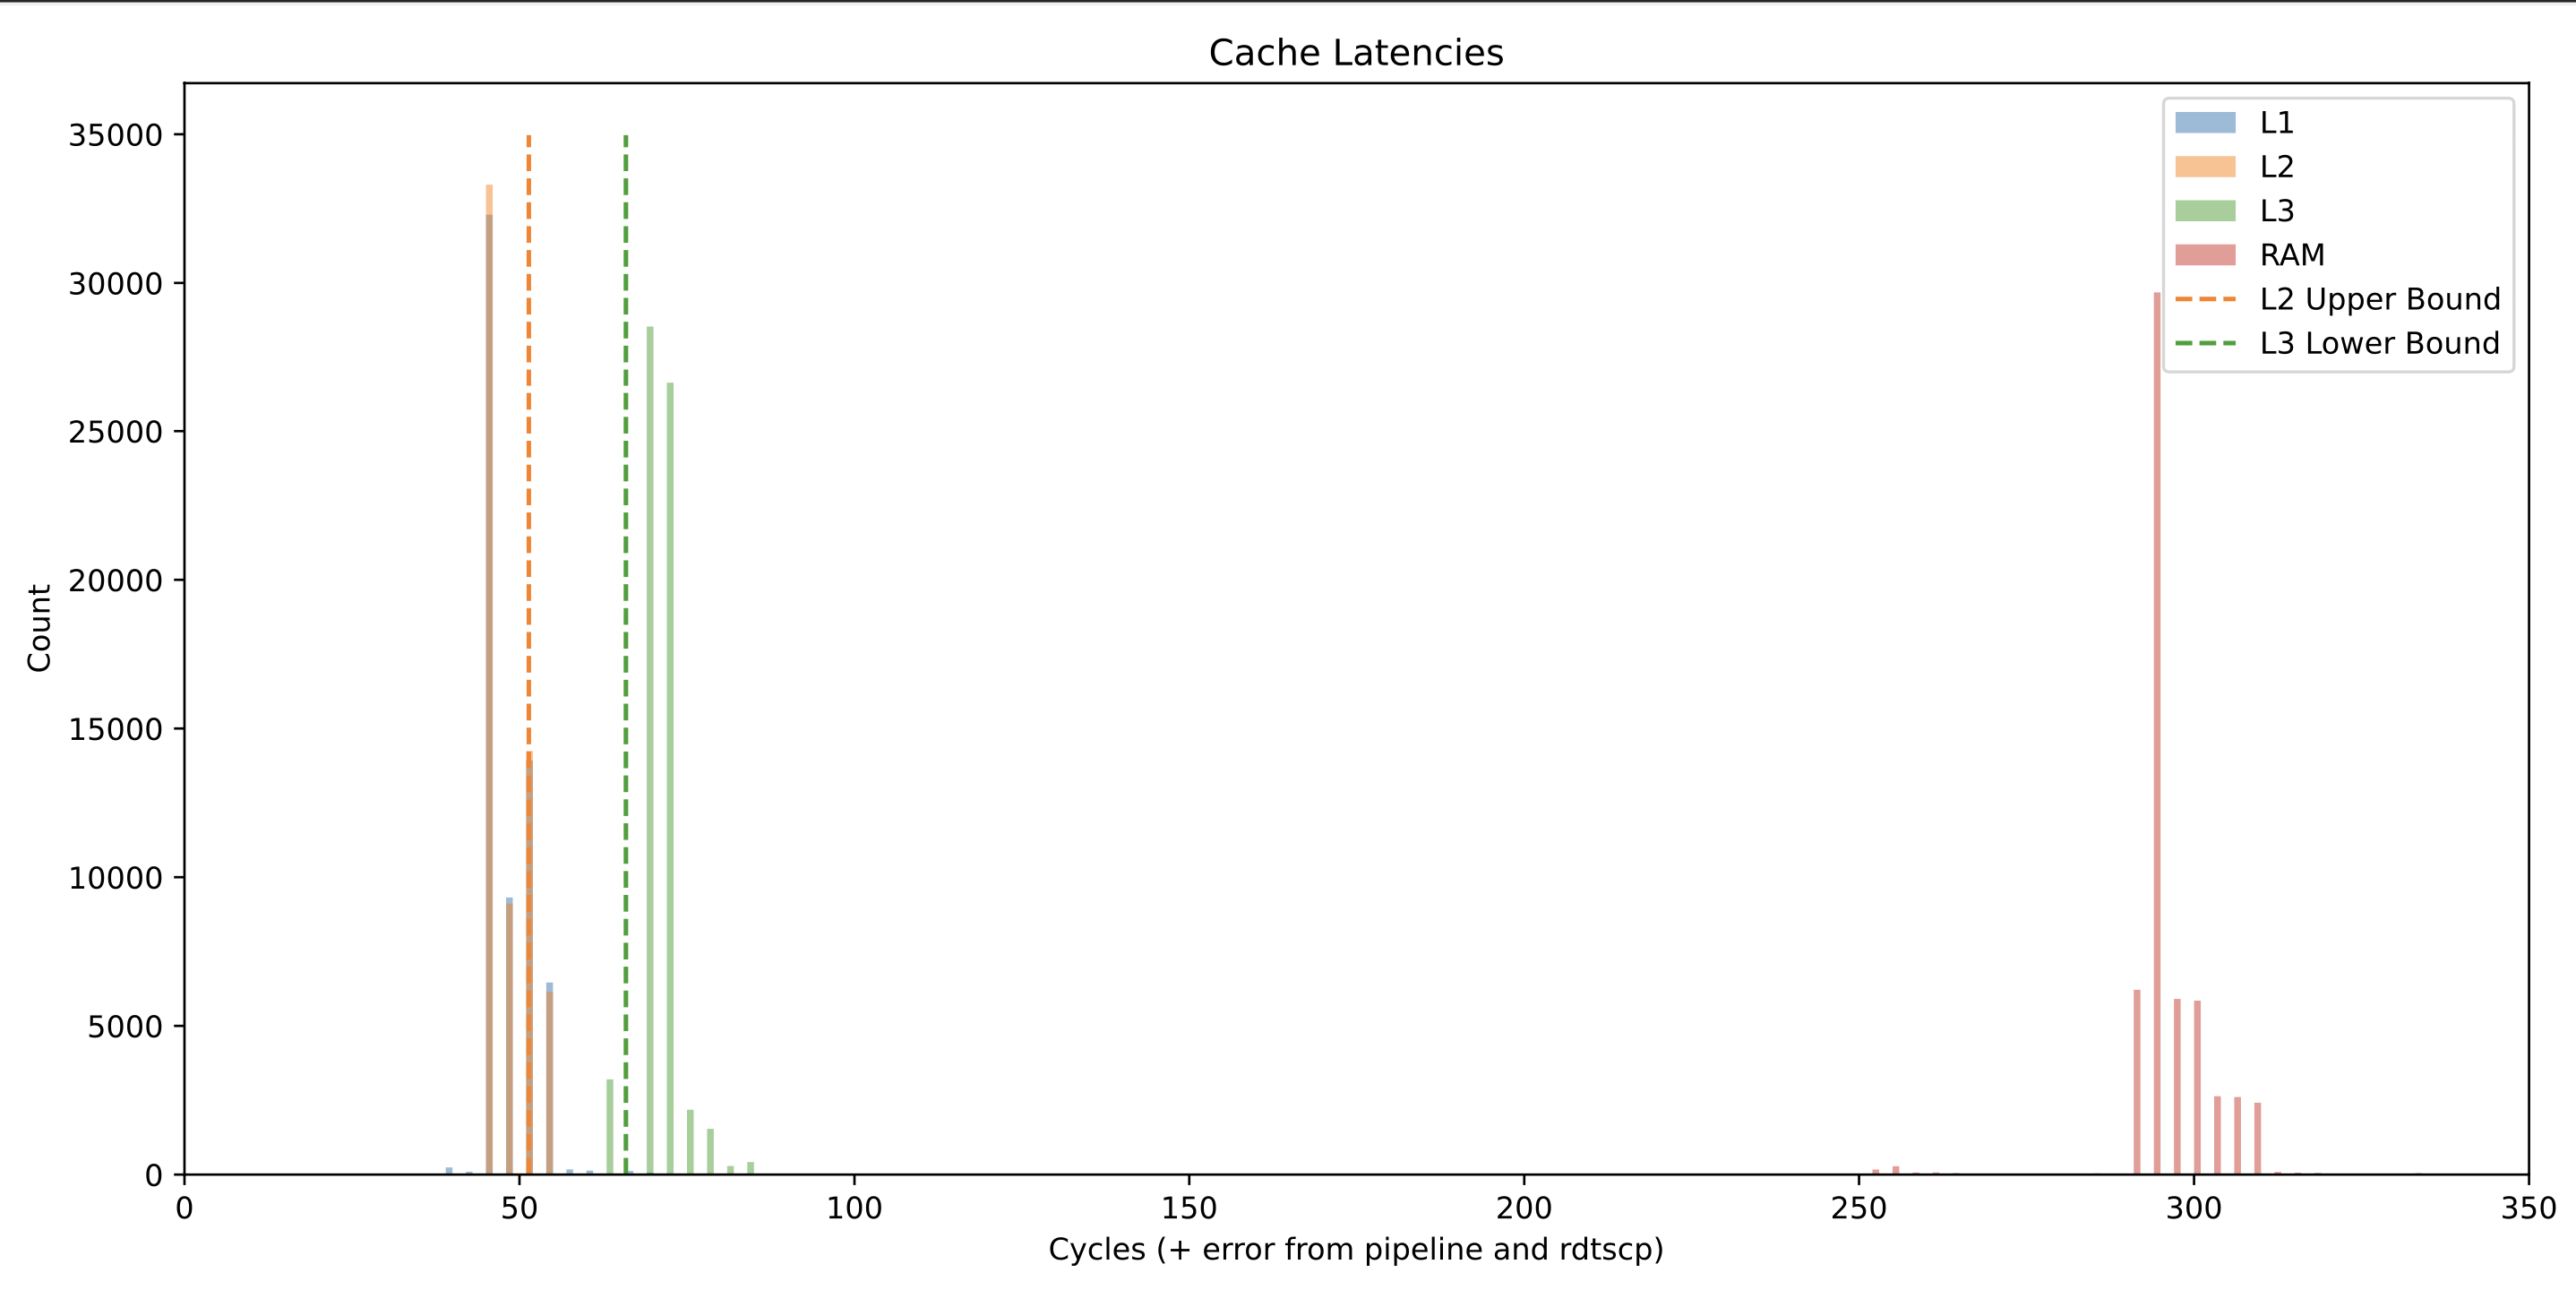
-O3